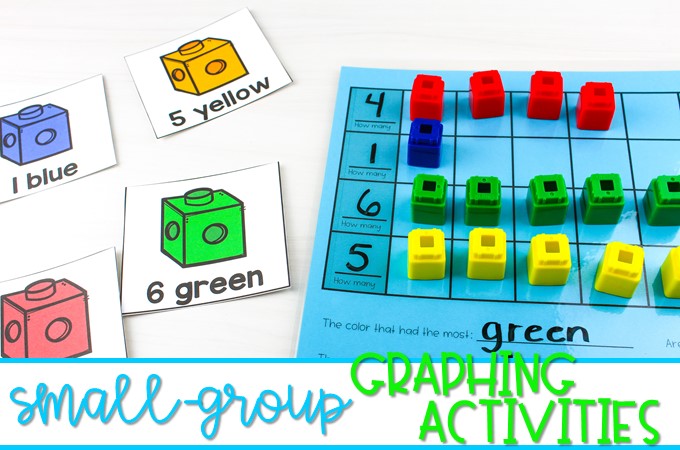
Graphing Activities to practice measurement and data. Concrete, pictorial, and abstract activities to develop a deeper understanding of mathematics.
Graphing Activities
In Kindergarten, students should be able to describe and compare measurable attributes, in addition to, classifying objects and giving the numeral value. During small-group instruction, students can gain a deeper understanding of mathematical concepts. So, make your math small-groups engaging and effective with this math unit. It includes 11 lessons that provide students the opportunity to practice measurement and data.
Using the CPA approach, we give students the opportunity to experiment with mathematics in a variety of ways. Research shows it’s a highly effective approach to teaching that develops a deep and sustainable understanding of math.
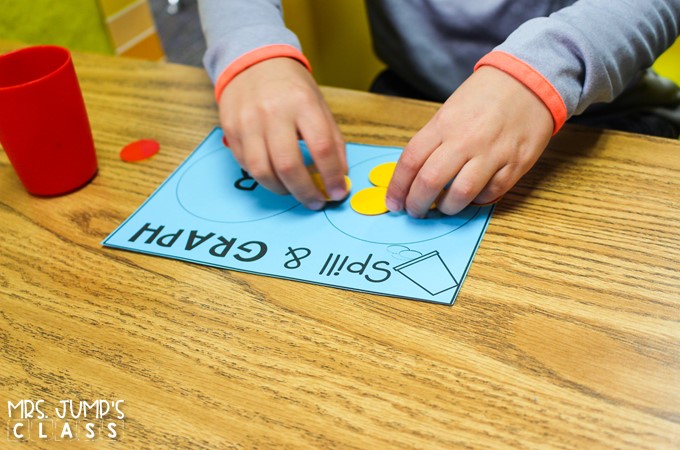
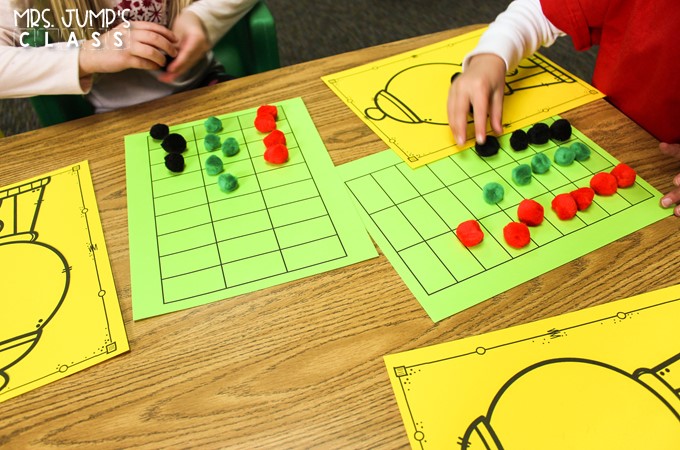
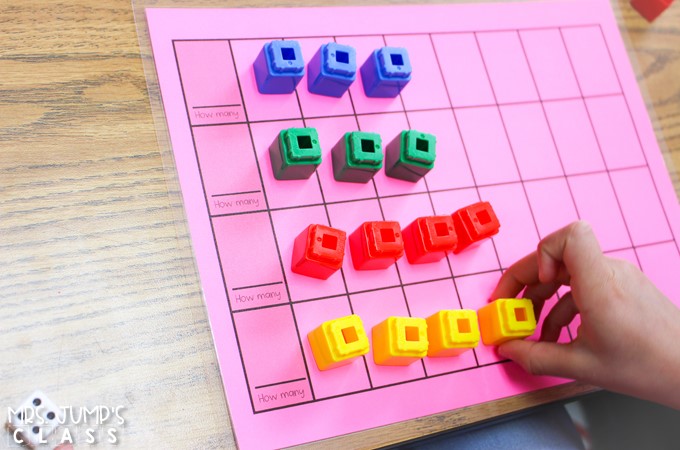
These students are using concrete materials to develop an understanding of sorting and graphing.
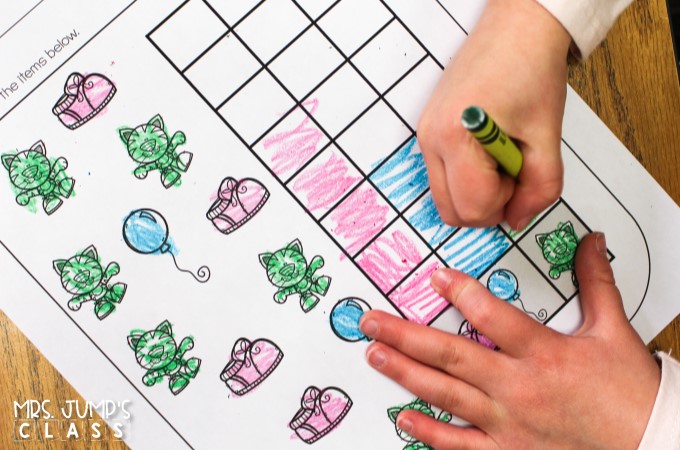
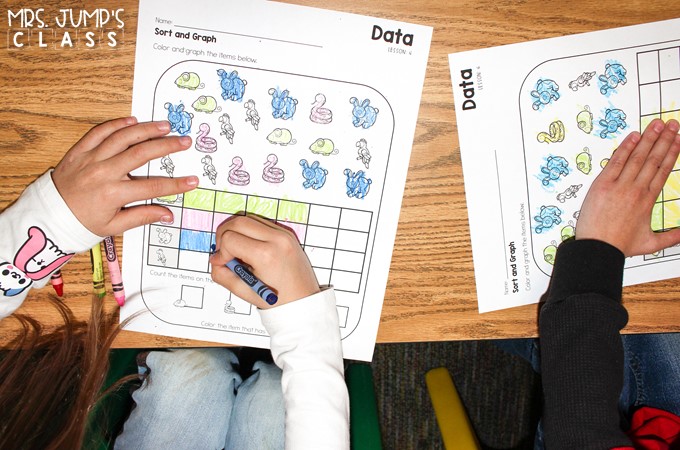
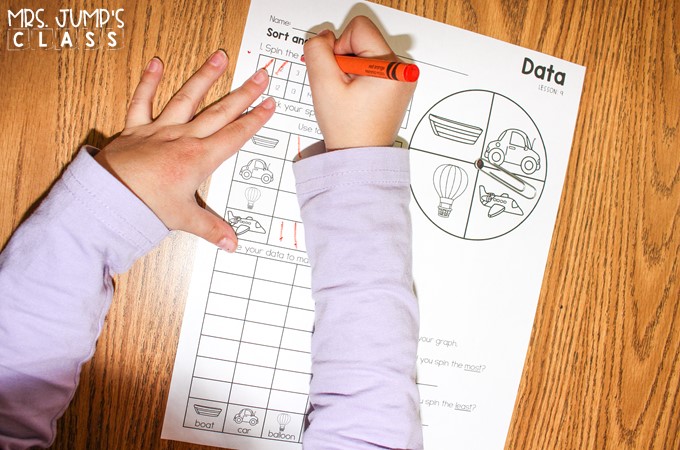
As we move onto the pictorial stage, students use representations of the objects to model problems.

Each lesson in the small-group unit includes a lesson plan and any printable resources you may need. In the activity below, students roll a die to determine the number of cubes to add their graph.
After the graph is complete, ask questions such as:
- “Which had more?”
- “Which had less?”
- “Are there any that are the same?”
- “How many more __ than __?”
Then, students extend the practice through additional activities.
Practice graphing data with your small-groups in math. The resources you’ve seen in this post can be found here:
Or, check out the whole bundle! It is filled with tons of engaging resources to support kindergarten math standards within your small-groups!
Do you need some math center ideas for the rest of your class while you’re running small groups? Here are a few options:
- 21 Math Centers to Practice Numbers to 10
- 27 Math Centers to Practice Numbers to 30 in Kindergarten
- Hands-on Math Activities using Snap Cubes